部署 Monit 来监控服务
#编程技术 2022-01-06 15:50:00 | 全文 3502 字,阅读约需 7 分钟 | 加载中... 次浏览👋 相关阅读
- 闲置服务器薅京东的羊毛—青龙面板部署与京东签到
- RS1.ES 免费Linux云服务器,单次使用3小时,不限次数!
- Nginx常用屏蔽规则,让网站更安全
- Linux VPS 安装 5.9 宝塔面板并免费升级到专业版
- vim/vi 常用快捷键记录
Monit 是一个轻量的监控工具,大小不到 2M,可运行于 linux 之上。

它提供的功能很丰富,它可以监控本机的 CPU、文件、目录、进程等基本信息,例如 Mysql,PostgreSQL,Redis,Nginx 等,还能监控本机的网卡,包括网卡 UP/Down、网络流量告警,还能监控其它主机的网络可达性,包括第 4 层协议、第 7 层协议,HTTP 做为第 7 层协议自然也支持。
假如服务出了问题,它发现告警之后,能定义各种告警动作,包括发送邮件,重启进程,运行特定脚本/程序等。
它也提供 web 界面供查看,可以查看每个服务的 CPU,内存使用量等。
常见的集中式的监控系统,如 nagios,zabbix,cacti,是在一台主机上监控所有其它主机,存在单点故障。 monit 一般部署在每台需要监控的主机上,可以认为是分布式系统,可以作为集中式监控的补充。
monit 只有一个配置文件,在 monit 启动命令行指定。
官网地址:https://mmonit.com/monit/
安装
注意:monit 只有类 unix 版本,没有 windows 版本,mac 有客户端版本。
Monit 的安装配置都是比较简单的,如果运行在 ubuntu 下可以用 apt-get 安装,Centos 系统的可以直接 yum 安装。
sudo apt-get install monit
安装好以后,可执行文件为 /usr/bin/monit,配置文件为 /etc/monit/monitrc,daemon 文件为 /etc/init.d/monit,还有一个 upstart 的启动文件,若干 man,example 文件,总共 2M 不到。
当然也可以选择源码编译安装,下面介绍编译安装,还是 linux 编译安装三步曲。
首先去官网下载:https://mmonit.com/monit/
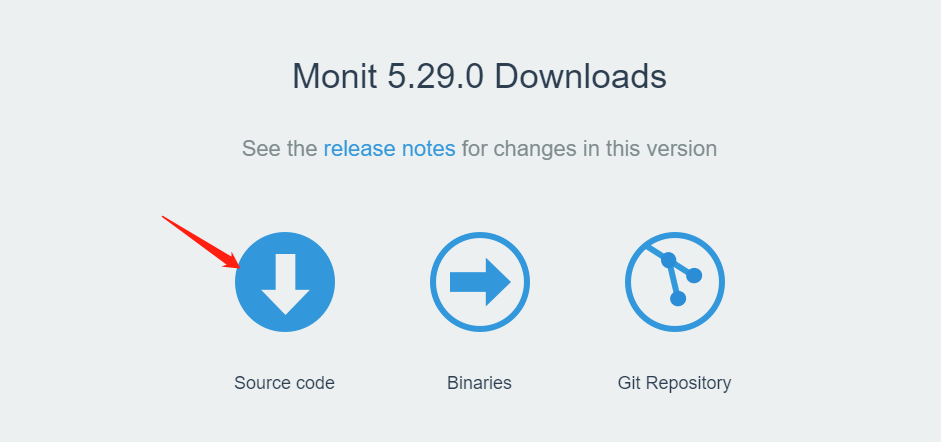
点击 Source code 下载源代码
我这里以 centos 系统为例
1、解压安装包
tar xvf monit-5.29.0.tar.gz
2、进入解压后的目录
mv monit-5.29.0 monit&&cd monit/
3、依次执行下边编译安装三部曲
./configure --without-pam
make
sudo make install
官方提供的安装方法:https://mmonit.com/wiki/Monit/Installation
假如中间遇到各种问题,只要找到报错的地方,到 google 上搜索,一般都可以找到解决方法的。
启动
在 monit 的安装目录下就有一个示例的配置文件 monitrc,把它复制出来。如果不是编译安装的话,配置文件是 /etc/monit/monitrc。
启动 Monit
sudo ./monit -c monitrc
-c 后边跟的是 monitrc 文件的路径
查看Monit的状态。
./monit status
输出如下的内容。
System 'iZ94x9hoenwZ'
  status                            Running
  monitoring status                 Monitored
  load average                      [0.00] [0.06] [0.09]
  cpu                               1.2%us 0.6%sy 0.0%wa
  memory usage                      490.4 MB [49.4%]
  swap usage                        20.4 MB [1.9%]
  data collected                    Fri, 25 Sep 2015 14:20:57
停止Monit
sudo ./monit quit
具体的使用方法可以用 monit --help 查看。
配置
官方的配置说明:https://mmonit.com/wiki/Monit/ConfigurationExamples
monitrc 本身就是一个详细的配置帮助文件,根据我们的目标,选择适合自己的一些配置。
## 每隔 30 秒检查一次
set daemon  30
## 设置记录日志
set logfile syslog

## web界面,监控在 2812 端口,用户名是 admin,密码是 monit
set httpd port 2812 and
    ## use address localhost  ## only accept connection from localhost
    ## allow localhost        ## allow localhost to connect to the server and
    allow admin:monit read-only     ## require user 'admin' with password 'monit'

## 监控 PostgreSQL 示例
check process postgresql with pidfile /var/run/postgresql/9.3-main.pid
   start program = "/etc/init.d/postgresql start" with timeout 60 seconds
   stop program = "/etc/init.d/postgresql stop"

## 监控 Nginx 服务示例
check process nginx with pidfile /run/nginx.pid
   start program = "/etc/init.d/nginx start" with timeout 60 seconds
   stop program = "/etc/init.d/nginx stop"

## 监控 redis 服务示例
check process redis with pidfile /var/run/redis_6379.pid
  start program = "/etc/init.d/redis_6379 start" with timeout 60 seconds
  stop  program = "/etc/init.d/redis_6379 stop"

## 监控 unicorn 示例
## check process xy_unicorn with pidfile /home/yinsigan/xy/shared/tmp/pids/unicorn.pid
  ## if does not exist for 1 cycle
    ## then exec "/etc/monit/slack_notifications.sh"
    ## else if succeeded for 3 cycles then alert

## 监控 puma 示例
check process xy_puma with pidfile /home/yinsigan/xy/shared/pids/puma.pid
check process xy_puma_staging with pidfile /home/yinsigan/xy_staging/shared/pids/puma.pid

## 监控 sidekiq 示例
check process xy_sidekiq with pidfile /home/yinsigan/xy/shared/pids/sidekiq.pid
check process xy_staging_sidekiq with pidfile /home/yinsigan/xy_staging/shared/pids/sidekiq.pid

## 监控硬盘示例
check filesystem datafs with path /dev/xvda1
 start program  = "/bin/mount /data"
 stop program  = "/bin/umount /data"
 if failed permission 660 then unmonitor
 if failed uid root then unmonitor
 if failed gid disk then unmonitor
 if space usage > 80% for 5 times within 15 cycles then alert
 if space usage > 99% then stop
 if inode usage > 30000 then alert
 if inode usage > 99% then stop
 group server

## 监控URL地址示例(以下示例监控 https://blog.wangtwothree.com/code/173.html 地址能否打开)
check host Blog with address blog.wangtwothree.com
  if failed port 80 protocol https request "/code/173.html" then alert

## 监控进程名示例
check process nginx matching "nginx"
  if failed nginx then alert
通过 pid 来监控是一种有效的方式。
修改配置后需要重载配置文件,这跟 Nginx 等服务差不多。
sudo ./monit reload
检查配置文件的语法。
sudo ./monit -t
启动所有服务。
sudo ./monit start all
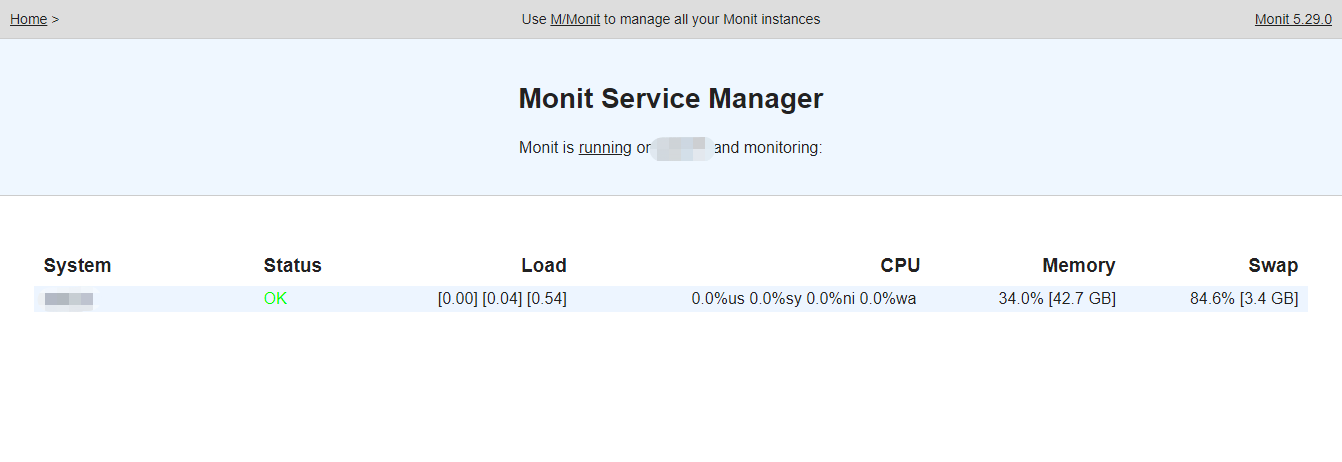
输入 http://你的服务器IP:2812 就可以访问监控页面了。
常用配置说明
email 告警配置
set mailserver smtp.163.com
  username xxx@xxx.com
  password xxxx
  using sslv3

set mail-format {
    from: xxx@xxx.com
    reply-to: xxx@xxx.com
    subject: monit alert $SERVICE $EVENT
    message: Monit alert at $DATE
             $HOST $ACTION $SERVICE
}
set alert xxx@xxx.com
set eventqueue basedir /var/lib/monit/events slots 100
第一组命令指定 smtp 服务器以及相应的账号和 ssl 版本,smtp 服务器用来发送告警邮件。
第二组命令指定告警邮件的格式,可用的变量为
$EVENT: 事件 $SERVICE: 服务名称。monit将每个监控对象定义成服务,实际上就是监控对象 $DATE: 告警日期和时间 $HOST: monit运行的主机,这在多台主机都运行monit的时候有用 $ACTION: 告警发生后,monit的动作。这个动作在定义监控服务的时候指定。 $DESCRIPTION: 告警描述
第三条命令指定告警邮件接收人,可以有多个,使用,分隔
第四条命令指定当 smtp 服务器有故障的时候,本地暂存告警邮件的位置以及数量,这里暂存 100 条
上面是全局的邮件告警配置,在后面配置单个服务的时候,还可以指定针对这个服务的告警配置,当两者有冲突时,以单个服务的配置为准。
定义服务
定义服务,就是定义监控对象。monit 文档都叫服务,我觉得这里叫做监控比较好。
服务类型
monit 可以定义 9 种类型,包括process/file/fifo/filesystem/directory/system/program/network/host。
process: 监控指定进程是否存活 file/fifo/filesystem/directory: 监控指定的文件或者目录是否存在 system: 监控系统资源,包括CPU、内存和负载 program: 监控指定程序的退出代码或者运行时间的长短 network: 监控系统指定 interface,包括 up/down,带宽,误码率,流量,ping host: 监控其它主机,可以定义端口、tcp/udp、protocol(http/mysql/websocket)。protocol 为 http 的时候,还可以进一步定义 url 和返回内容
例如目标是监控主机的 web 端口,因此用 host 类型,相应的配置语法为
check host <service> address <host ip address>
监控web端口示例
check host csa35 with address 10.7.83.35
        if failed port 80 protocol http then alert
        if failed port 9080 protocol http then alert
        if failed port 9081 protocol http then alert
这个基本上是自然语言了。相应的业务逻辑为:
检查主机(check host),服务名称($SERVICE)为 csa35,ip 地址为 10.7.83.35,如果 http 80/9080/9081 失败,则告警
这里不指定 url,默认的 url 是 /
服务测试
服务测试提供了测试监控对象状态的一种方法,根据状态不同,可以指定相应的动作
通用语法为
if <test> then <aciton1> else if succeeded then <action2>
test 有几种类型
状态失效,如网络不可达,进程丢失如果失败 参数变化,如文件权限,文件 md5,文件大小,日期等 参数达到门限,如 CPU>80%, 磁盘空间大于 85% 当 test 为真时,则执行 action1 当从失效状态转到正常状态,则执行 action2,这一句是可选项
action 有5种类型
alert: 发送告警邮件 restart/start/stop: 重启/启动/停止 service。在监控进程时特别有用,先定义 start、stop、restart 的命令,当进程丢失时,启动相应 service,恢复进程 exec: 执行用户定义的命令或者脚本
监控 apache 进程示例,比较全面展现了 monit 的能力
check process apache with pidfile /var/run/httpd.pid
       start program = "/etc/init.d/httpd start"
       stop program  = "/etc/init.d/httpd stop"
       if cpu > 40% for 2 cycles then alert
       if total cpu > 60% for 2 cycles then alert
       if total cpu > 80% for 5 cycles then restart
       if mem > 100 MB for 5 cycles then stop
       if loadavg(5min) greater than 10.0 for 8 cycles then stop
使用 pidfile 监控进程,服务名为 apache start 命令 stop 命令 如果 2 次轮询,进程 cpu 都大于 40%,则告警 如果 2 次轮询,系统 cpu 都大于 60%,则告警 如果 5 次轮询,系统 cpu 都大于 80%,则重启(先 stop,再 start) 如果 5 次轮询,内存 mem 都大于 100MB,则 stop 如果 8 个次轮询,5 分钟平均负载都大于 10,则 stop
更多配置查看官方手册:https://mmonit.com/monit/documentation/monit.html
补充:
不想使用邮件通知的可以自己写一个脚本,调用脚本来达到使用其他通知方式的目的,比如我这里就写了一个 python 脚本来调用企业微信的通知
robot.py
#!/usr/bin/env python
## coding=utf-8

## @Time    : 2020/8/31 11:00
## @Author  : 王图思睿
## @Site    :
## @Software: PyCharm
import requests, json, sys

def send(content):
    if content:
        url = ""  ## 填写你自己的企业微信机器人配置链接
        headers = {"Content-Type": "text/plain"}
        data = {
            "msgtype": "markdown",
            "markdown": {
                "content": content,
            }
        }
        requests_url = requests.post(url, headers=headers, data=json.dumps(data), proxies={"http": None, "https": None})
        if requests_url.text == '{"errcode":0,"errmsg":"ok"}':
            print("发送成功")
        else:
            print("发送失败" + requests_url.text)


if __name__ == '__main__':
    if len(sys.argv) > 1:
        msg = sys.argv[1]
    else:
        msg = 'Test'
    send(msg)
使用方式
python robot.py 要发送的消息内容
配合 monit 监控使用方式
## 邮件通知方式
## 监控URL地址示例(以下示例监控 https://blog.wangtwothree.com/code/173.html 地址能否打开)
check host Blog with address blog.wangtwothree.com
  if failed port 80 protocol https request "/code/173.html" then alert

## 企业微信通知
## 监控URL地址示例(以下示例监控 https://blog.wangtwothree.com/code/173.html 地址能否打开)
check host Blog with address blog.wangtwothree.com
  if failed port 80 protocol https request "/code/173.html" then "/usr/bin/python3 /robot.py 博客打不开了"
注意:如果使用 python 脚本,要使用绝对路径!
自编 shell 脚本利用 iostat 获取 IO 使用率
get_io_stat.sh
#!/bin/sh
STATUS=`iostat -x 1 2 sda| awk '{if($1 == "sda") {if(t){sum+=$14};t++}}END{print sum/(t-1)}'`
function ceil(){
  floor=`echo "scale=0;$1/1"|bc -l ` ## 向下取整
  add=`awk -v num1=$floor -v num2=$1 'BEGIN{print(num1<num2)?"1":"0"}'`
  echo `expr $floor  + $add`
}
echo `ceil $STATUS`"%"
exit `ceil $STATUS`
监控配置方式:
## 监控磁盘IO使用率
check program IO使用率 with path "get_io_stat.sh"
  if status > 90 then alert
via:
使用monit监控URL | 折腾手记 http://lyallchan.github.io/2016/02/17/%E4%BD%BF%E7%94%A8monit%E7%9B%91%E6%8E%A7URL/
部署之使用 Monit 来监控服务 (四) - 知乎 https://zhuanlan.zhihu.com/p/339082230
莫尼特手册 https://mmonit.com/monit/documentation/monit.html
M/Monit |维基 https://mmonit.com/wiki/Monit/ConfigurationExamples
monit(一)–在centos7.4中编译安装monit_nowzhangjunzhe的博客-CSDN博客_安装monit https://blog.csdn.net/nowzhangjunzhe/article/details/83892261